

Quick Summary: What is xG Soccer Betting
xG soccer betting uses expected goals data to better understand chance quality, team strength, and match odds. It does not predict the final score with certainty. It simply helps you see whether a team is creating good chances or only getting lucky with the scoreboard.
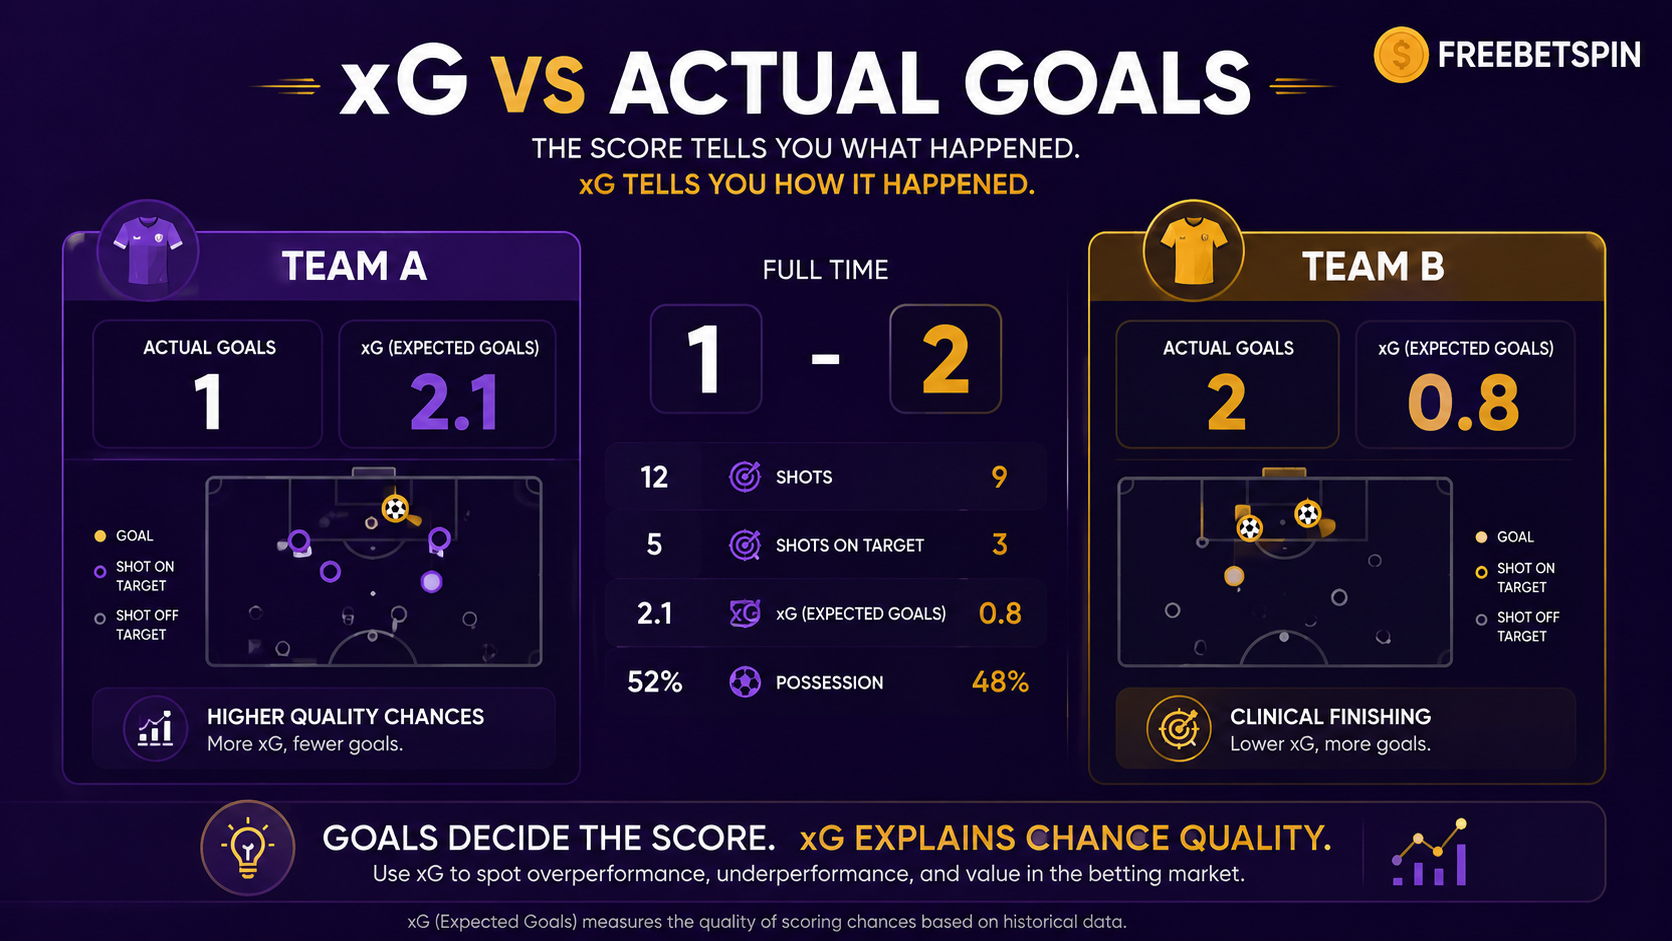
Imagine a World Cup match where Team A wins 1–0 but creates only one weak chance. Team B loses but creates five strong chances and finishes with 2.1 expected goals. The score says Team A won. The xG story says Team B may have played better than the result suggests.
That is why xG can be useful. It gives you another layer beyond goals, highlights, and team reputation.
xG soccer betting explained with expected goals match odds and World Cup predictions
Concept | Simple Meaning |
xG | Expected goals; estimated chance quality |
0.10 xG shot | Low-quality chance |
0.50 xG shot | High-quality chance |
Team xG | Total chance quality created by a team |
xGA | Expected goals against; chance quality allowed |
Value betting | When your probability view is higher than the market’s implied probability |
Main risk | xG explains chances, not guaranteed results |
In betting terms, xG is best used as a reading tool. It can help you understand why match odds move, why a team may be underrated or overrated, and why high odds are not automatically good value.
What Is xG in Soccer?
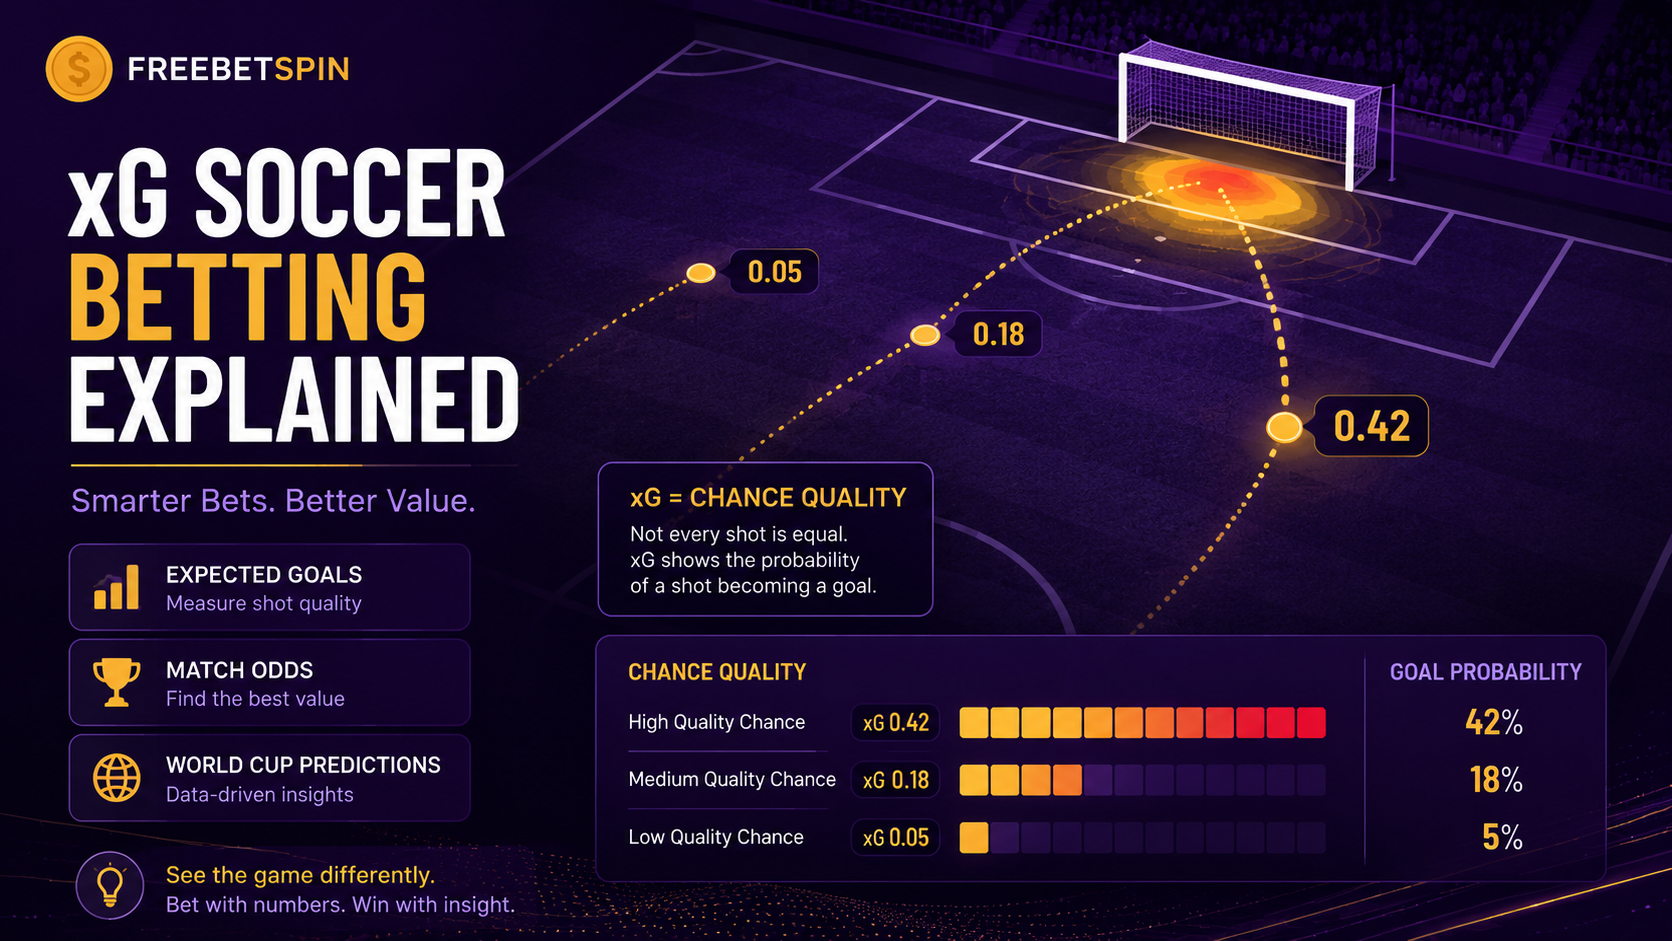
xG stands for expected goals. It measures how likely a shot is to become a goal based on the quality of the chance.
A shot from 30 yards may have very low xG because shots from that area rarely become goals. A close-range shot in front of goal has higher xG because similar chances are scored more often. A penalty is usually a high xG chance because penalties are converted much more often than most open-play shots.
Opta defines expected goals as a metric that measures chance quality by calculating the likelihood that a chance will be scored using information from similar past shots. Hudl / StatsBomb explains xG as a probability metric on a 0 to 1 scale, where a 0.2 xG chance would be expected to become a goal about two times in ten similar attempts.
Shot Type | Example xG Range | Plain-English Meaning |
Long-range shot | 0.02–0.05 | Low-quality chance |
Header under pressure | 0.05–0.12 | Difficult chance |
Open-play shot inside box | 0.15–0.35 | Moderate to good chance |
One-on-one chance | 0.30–0.50+ | High-quality chance |
Penalty | Around 0.75–0.80 | Very high-quality chance |
In simple terms, xG tells you whether a team is creating dangerous chances, not just taking shots.
That matters for xG soccer betting because not all shots are equal. Ten weak shots from bad angles may be less impressive than three clear chances in the box.
Why xG Can Be More Useful Than Goals Alone
Goals decide matches, but they do not always explain performance. A team can score from a deflection, a goalkeeper mistake, or one low-quality chance. Another team can dominate the box, create several good looks, and still lose.
xG helps you separate the scoreline from the chance quality.
Match Result | xG Story | What It Suggests |
Team A wins 1–0 with 0.4 xG | Low chance quality despite the win | Result may flatter Team A |
Team B loses 0–1 with 2.1 xG | Strong chances but no finishing | Performance may be better than score |
2–2 draw with similar xG | Chance quality was balanced | Scoreline matches the match flow |
3–0 win with 3.2 xG | Strong result and strong chance creation | Performance supports the scoreline |
High goals but low xG | Results may be less sustainable | |
Weak xG trend | Market confidence may decline | |
Tactical matchup | Styles affect shot quality | |
Market odds | Shows what the betting market expects |
This is why you will often see analysts talk about “underlying performance.” They are not saying goals do not matter. They are saying goals alone can be noisy, especially in a low-scoring sport like soccer.
For example, if a World Cup favorite wins 1–0 but creates very little, the market may still price that team as strong because of reputation. But the xG record may suggest caution. On the other hand, an underdog that loses narrowly while creating high-quality chances may be more competitive than the final score suggests.
xG soccer betting comparison showing expected goals vs actual goals and value betting
How xG Soccer Betting Connects to Match Odds
In xG soccer betting, you are not using xG as a crystal ball. You are using it to understand whether the odds make sense.
Match odds reflect many things: team strength, injuries, lineups, public betting, rest, travel, tactics, bookmaker margin, and market movement. xG can support that picture by showing whether a team is creating and conceding good chances.
xG Signal | Possible Odds Connection |
High xG created | Team may be more dangerous than goals show |
Low xGA conceded | Defense may be stronger than goals conceded |
Strong xG difference | Market may rate team higher |
Poor finishing but strong xG | Team may improve if chances continue |
High goals but low xG | Results may be less sustainable |
Weak xG trend | Market confidence may decline |
If a team consistently creates 1.8 xG per match and allows only 0.7 xG, it is probably controlling chance quality. If another team scores three goals from 0.6 xG, that result may be harder to repeat.
This connects directly to odds. If you do not understand how odds express probability, read Freebetspin’s guide to soccer betting odds explained before relying on xG for market decisions.
How xG Can Feed a Soccer Prediction Model
A soccer prediction model may use xG for and xG against to estimate how strong two teams are. It might then turn those estimates into probabilities for win, draw, loss, totals, or both teams to score.
You do not need to understand every formula. Think of it like this: a model estimates how many good chances each team may create, then turns that into a probability view.
Model Input | Why It Matters |
xG for | Measures chance quality created |
xG against | Measures chance quality allowed |
Recent form | Captures current rhythm |
Squad availability | Injuries and suspensions affect chances |
Rest and travel | Important during tournaments |
Venue context | Home, away, or neutral site can matter |
Tactical matchup | Styles affect shot quality |
Market odds | Shows what the betting market expects |
For example, a simple model may project Team A to create around 1.6 expected goals and Team B to create around 0.9 expected goals. That does not mean the final score will be 2–1. It means Team A is projected to create better scoring chances more often.
A good model still needs common sense. If Team A rotates half the starting lineup, the old xG trend may not apply as strongly. If a team’s star striker is injured, finishing quality and shot volume can change.
A Simple Poisson Example Without the Headache
Poisson is a probability method often used in soccer modeling because soccer scores are usually low. You do not need to memorize the math. The basic idea is simple: if we estimate how many goals each team is likely to score, we can estimate the chance of different scorelines.
Imagine a model projects this:
Team | Projected Expected Goals |
Team A | 1.6 |
Team B | 0.9 |
A simple probability model can use those numbers to estimate likely score ranges. Team A may be more likely to win because its expected goals number is higher. But Team B can still win because soccer is random and low-scoring.
Possible Result Type | Simple Interpretation |
Team A win | More likely than Team B win because Team A projects higher |
Draw | Still possible because soccer has low scores |
Team B win | Less likely, but not impossible |
Over 2.5 goals | Depends on combined goal expectation |
Under 2.5 goals | More likely if projected goals are low |
This is the part that matters for you: xG can help produce a probability view, but it cannot remove uncertainty. A team projected at 1.6 xG can score zero. A team projected at 0.6 xG can score from one perfect counterattack.
That is why xG soccer betting should support your judgment, not replace it.
What Is Value Betting?
Value betting means your probability estimate is higher than the market’s implied probability.
It does not mean “the odds are high.” It does not mean “the underdog looks fun.” It means the price may be better than the actual chance you believe the outcome has.
Your View | Market View | Value? |
You think a team has a 45% chance | Market odds imply 38% | Possible value |
You think a team has a 20% chance | Market odds imply 25% | Not value |
You like +800 odds | True chance is only 8% | Big payout, not necessarily value |
You like a favorite at -150 | Your model gives it 65% | Possible value |
Smarkets explains implied probability as the conversion of betting odds into a percentage chance, which is a useful step when comparing your probability view with the market price.
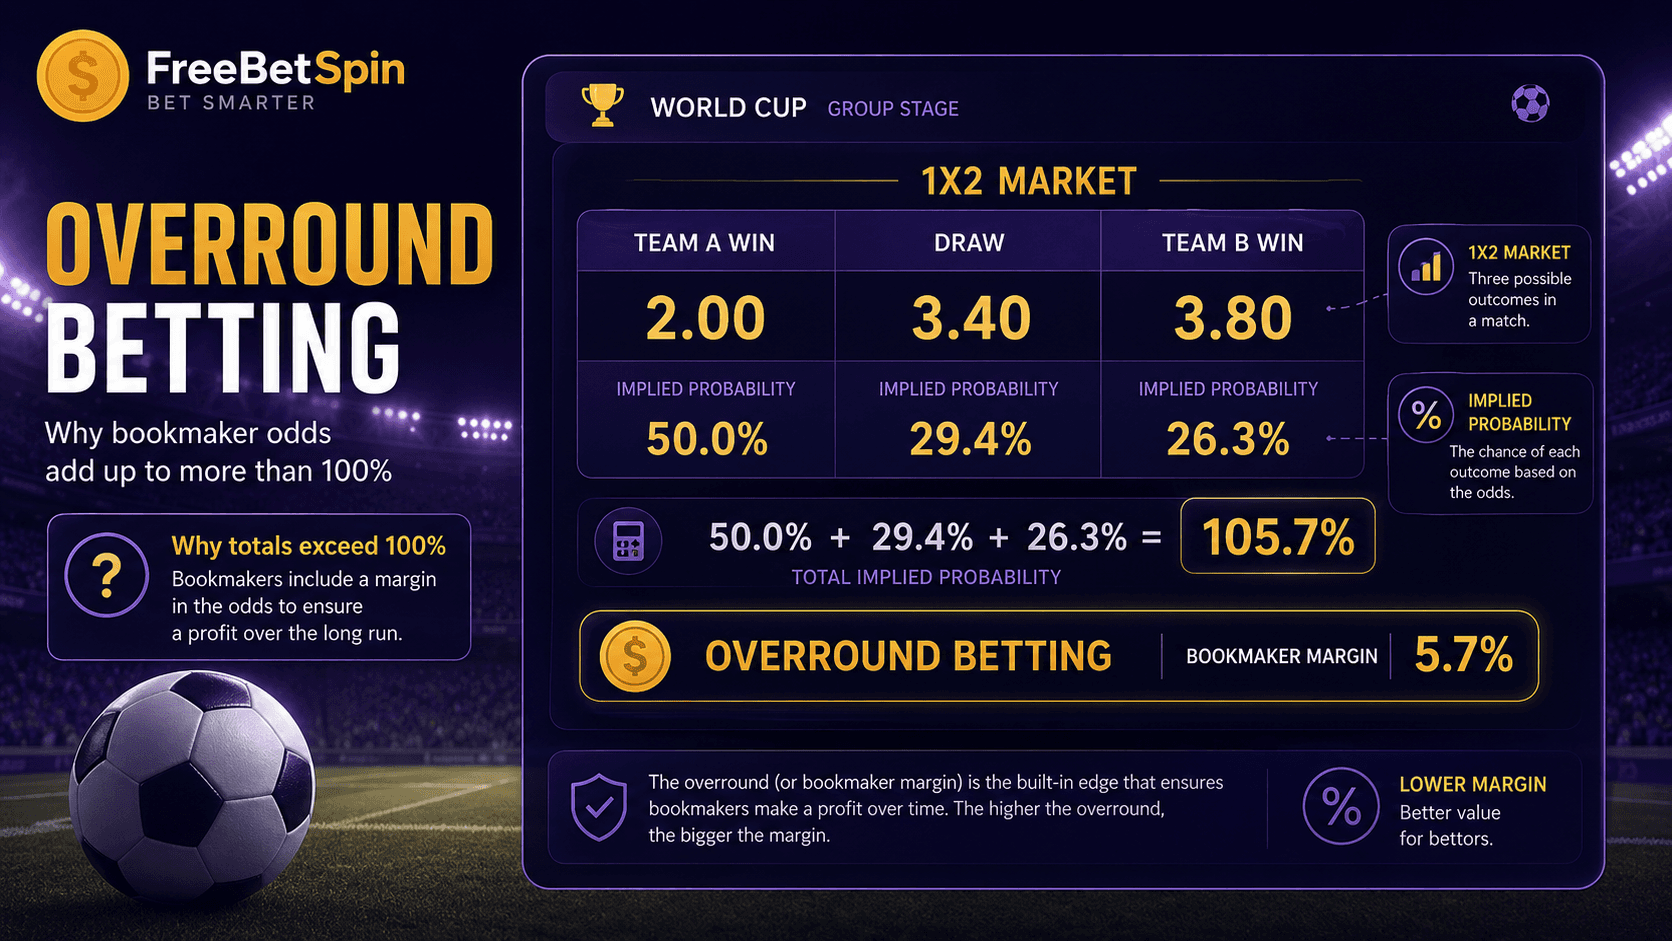
For a deeper explanation of why market percentages often include bookmaker margin, read Freebetspin’s overround betting explained guide.
The main lesson is simple: value is about probability versus price. xG can help you build the probability side, but the odds tell you the price.
Why High Odds Do Not Always Mean Value
High odds can be tempting. If a World Cup underdog is +1000, the payout looks exciting. But that does not automatically make it a value bet.
A high price usually means the market thinks the outcome is unlikely. To call it value, you need a reason to believe the market is underestimating the team’s chance.
Betting Thought | Better Question |
“The odds are huge.” | Is the implied probability too low or too high? |
“This underdog could surprise people.” | How often does that upset really happen? |
“The payout is worth a small bet.” | Does the price beat your probability estimate? |
“The team had strong xG last match.” | Is it a repeatable trend or one-game noise? |
“The favorite looked bad once.” | Was that bad process or just one poor result? |
This is where xG soccer betting can help. If an underdog has been creating high-quality chances and conceding little, that may support a deeper look. But one good xG match is not enough to declare value.
You need context: opponent strength, injuries, game state, lineup changes, and whether the market has already adjusted.
Why xG Models Still Get Matches Wrong
xG is useful, but it is not magic. Soccer is low-scoring, and low-scoring sports have a lot of randomness.
A team can create 2.5 xG and lose. A team can create 0.4 xG and win. A goalkeeper can have an incredible match. A red card can change everything. A penalty can swing the scoreline in one moment.
Why xG Can Be Wrong | Simple Explanation |
Small sample size | One or two matches can mislead |
Finishing variance | Great chances can still be missed |
Goalkeeper performance | Saves can change results |
Red cards | Match state changes quickly |
Tactical changes | Teams adapt by opponent |
Game state | Teams leading or trailing change behavior |
Model differences | Data providers may calculate xG differently |
Penalties and set pieces | One event can swing a match |
Stats Perform describes xG as a model that estimates the likelihood of a chance becoming a goal using factors such as shot distance, angle, defensive pressure, and goalkeeper location. That kind of model can add valuable context, but it remains an estimate, not a promise.
This is why responsible betting matters. xG can make you better informed, but it cannot make outcomes certain.
How to Use xG During the World Cup
World Cup tournaments are perfect for xG discussion because fans react strongly to scorelines. A favorite wins narrowly, and people assume everything is fine. A strong team loses, and people assume the team is finished. xG can slow that reaction down.
Use xG After Matchday 1
The first group match can be misleading. A team may win but create very little. Another team may lose but produce better chances. xG helps you look under the scoreline before reacting.
Watch xG Difference, Not Just Total xG
A team that creates 2.0 xG but allows 2.1 xG is not controlling the match. A team that creates 1.5 xG and allows 0.4 xG may be more solid.
xG difference means xG for minus xG against. It is a quick way to see whether a team is winning the chance-quality battle.
Compare xG With Match Odds
If a team’s xG profile improves but match odds remain long, that may be worth deeper analysis. If odds have already shortened, the market may have already priced in the improvement.
Be Careful With Short Tournaments
The World Cup is short. Teams may only play three group matches before going home. One red card, one penalty, or one rotated lineup can distort the data.
World Cup Situation | How xG Helps |
Favorite wins 1–0 with low xG | Result may look stronger than performance |
Underdog loses but creates 1.8 xG | Team may be more competitive than score suggests |
Team allows few high-quality chances | Defense may be stronger than goals conceded |
Group leader rotates players | Past xG may not apply to new lineup |
Knockout match becomes cautious | Low tempo can reduce chance volume |
For a wider tournament view, read Freebetspin’s World Cup predictions and betting guide, which covers odds, markets, predictions, bonus terms, and betting mistakes.
Practical xG Soccer Betting Checklist
Before you use xG to support a betting opinion, slow down and ask a few simple questions. This keeps the data from becoming another excuse to bet emotionally.
Before Using xG | Check |
Is the sample size large enough? | ☐ |
Is the team creating repeatable chances? | ☐ |
Is xG boosted by one penalty-heavy match? | ☐ |
Is opponent strength considered? | ☐ |
Are injuries or rotation affecting the lineup? | ☐ |
Does the market implied probability already reflect this? | ☐ |
Are you using xG as support, not certainty? | ☐ |
Have you set a betting budget? | ☐ |
This checklist is especially useful during the World Cup because public opinion can move fast. A team can become “overrated” or “underrated” in the media after one dramatic result.
xG can help you stay calmer, but only if you use it with context.
Common xG Soccer Betting Mistakes
The biggest xG mistake is treating it like the real score. xG is not a goal count. It is a chance-quality estimate.
Another common mistake is using one match as proof. If a team produces 2.4 xG once, that does not mean it will do the same next game. The opponent, lineup, tactics, and match state can all change.
Mistake | Why It Hurts |
Treating xG as a guaranteed score | xG estimates chance quality, not exact outcomes |
Overreacting to one match | Small samples can mislead |
Ignoring opponent strength | High xG vs weak teams may not translate |
Ignoring game state | A team leading early may stop attacking |
Confusing value with high odds | Big payout is not the same as good price |
Forgetting market movement | Odds may already include xG-based information |
Ignoring legal access | U.S. betting rules depend on state |
Have you set a betting budget? | ☐ |
If you are in the U.S., legal access also matters. Betting availability depends on state rules, age requirements, sportsbook licensing, and location checks.
Conclusion: xG Helps You Understand Odds, Not Predict Certainty
xG soccer betting is useful because it helps you understand chance quality. It can show whether a team created dangerous opportunities, conceded poor chances, or benefited from a scoreline that may not fully reflect the match.
It can also support value betting by helping you compare your probability view with the market’s implied probability. But value does not mean high odds, and xG does not guarantee results.
Use xG as one part of your decision process. Combine it with odds, lineups, injuries, tactics, rest, travel, market movement, and responsible bankroll management.
The best way to think about xG is simple: it helps you understand the match better. It does not make the match predictable.